Big Ideas, Real Impact.
It all starts with an idea.
One spark of curiosity can turn data into direction, and maps into movement.
We’re here to bring that spark to life — one project, one story, one map at a time.
Our session will be
-
Personalized
Our initial sessions will be dedicated to assessing your current data/problem statement and creating a personalized plan to fit your unique needs and goals.
-
Targeted
Everyone has pain points when it comes to achieving data visualization. I’ll work closely with you to help identify and overcome your challenges while keeping outcomes in mind.
-
Integrative
We create geospatial tools that scale with you, becoming part of your long-term strategy rather than a standalone deliverable.
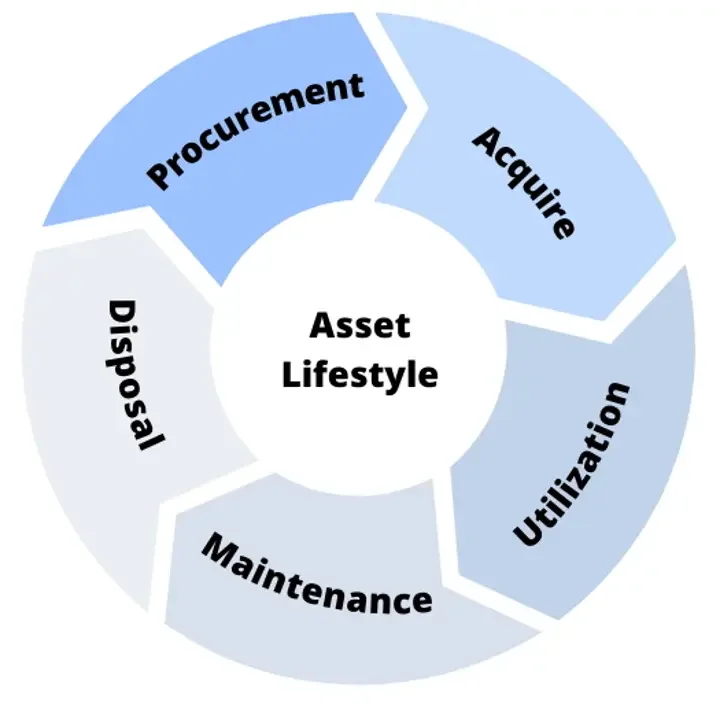
We help organizations design, deploy, and optimize geospatial asset management systems such as Cityworks, ensuring their infrastructure data is accurate, accessible, and actionable. From data modeling and system configuration to mobile workflows and reporting, we align asset management tools with real operational needs. Our approach integrates GIS with work order management, inspections, and lifecycle planning — empowering teams to maintain assets more efficiently, make informed decisions, and plan for the long term.

We design and build custom geospatial applications that turn data into usable, intuitive tools for everyday decision-making. From interactive web maps to mobile data collection apps, our solutions are tailored to how organizations actually work — in the field, in the office, and with the public. By combining GIS, user-centered design, and scalable technology, we create applications that support operations, increase transparency, and grow with your organization over time.
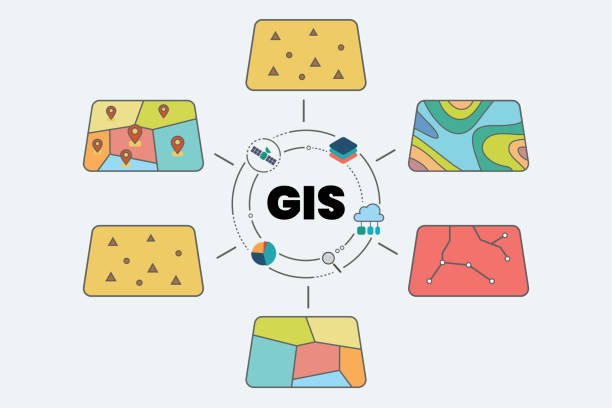
Helping organizations transform complex data into clear, compelling visual stories that inform, engage, and inspire action. Through interactive maps, dashboards, and thoughtfully designed visuals, we make data accessible to both technical and non-technical audiences. Our visual storytelling approach centers equity, context, and clarity — ensuring insights are not just seen, but understood and used to drive meaningful decisions.

what you’ll receive
outputs that are Built for clarity. Designed for impact.
BOOK YOUR FREE CONSULTATION.
A clear understanding of your goals
We’ll talk through what you’re trying to solve, who it’s for, and what success looks like.
Practical ideas tailored to your organization
You’ll leave with concrete suggestions for maps, apps, or data tools that fit your needs and capacity.Expert guidance without the jargon
We break down technical options in plain language so you can make confident decisions.Next steps you can actually act on
You’ll receive a clear path forward — whether that’s a project scope, timeline, or strategic recommendation.
